

 The government and its supporters have been quick to claim that the most recent GDP data have. George Osborne says the argument in favour of austerity has been won some more excitable commentators have even talked of a boom.
Usually, we would provide analysis of the GDP data after the publication of the national accounts, the third release in the cycle from the Office of National Statistics, which provides a detailed breakdown of the components on economic activity and the final revision to the data.
But the claims made for the British economy following the most recent GDP release (and some subsequent surveys) are so outlandish, and so at odds with the facts, that is worth providing a short analysis now. The data is still partial and subject to revision. But there is enough evidence to demonstrate factually that the weak recovery is not a reward for austerity, but is in fact entirely a function of increased government spending.
The economy has expanded by just 1.8% in 3 years of austerity, an annual rate of 0.6% which is less than one-quarter of previous trend growth. The gap between the current level of GDP and trend growth for the British economy is widening. In addition, the growth to date is entirely a function of increased government spending.
Factual Analysis
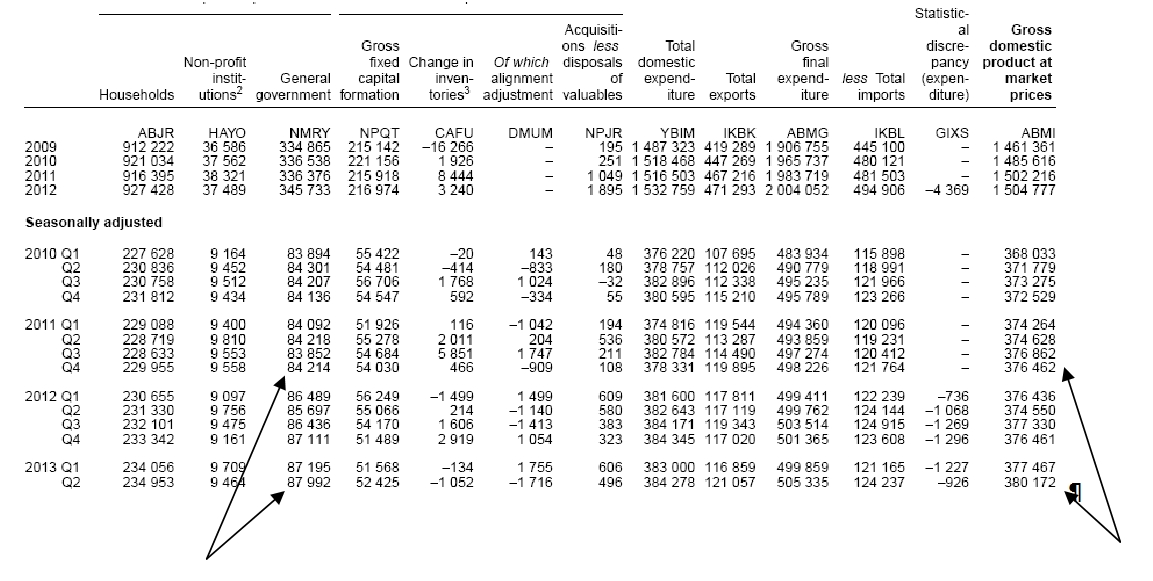
This verdict is so at odds with both stated government policy and the overwhelming commentary on the latest data. Therefore it is important to provide the hard evidence supporting this analysis. The can be found on Table C2 of the latest release, Second Estimate of GDP, Q2 2013 (ONS).
Total government current spending was barely changed from the time the Coalition took office to the end of 2011. (In the ordinary course of events real government spending should rise in line with population growth and in a recession should rise much faster to offset the effects of recession. Unchanged government spending represents a harsh ‘austerity’ stance).
However, from the 4th quarter of 2011 to the 2nd quarter of 2013 government current spending has risen decisively by an annualised £15.1bn. GDP did not begin to expand until two quarter later. This is the time lag we previously identified in the relationship between changes in government spending and changes in GDP. Rising government spending has led the recovery.
While the increase in government spending since the 4th quarter of 2011 to the most recent quarter amounts to £15.1bn, the rise in aggregate GDP over the same period is just £14.8bn. Therefore, the rise in government spending not only led the recovery, but more than accounts for the entire expansion over the same period (as some other components of GDP have contracted).
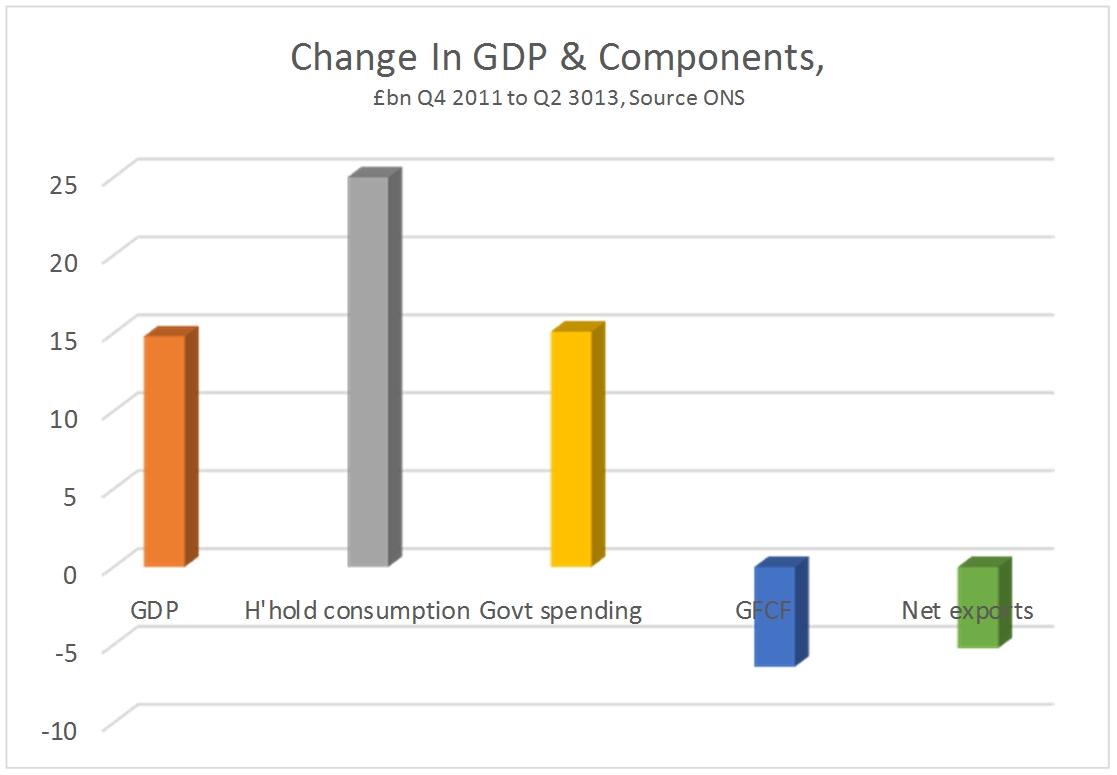
Rising government current spending tends to support consumption, which is exactly what has happened over the last 18 months. The rise in household consumption has been the strongest of all components of GDP over that period, rising by £25bn. The chart below shows the changes in the national accounts since the government began increasing its current spending after the 4th quarter of 2011.
But weak household spending is not the source of the crisis. This remains the slump in investment. GDP is still £50bn below its previous peak in the 1st quarter of 2008, but investment (Gross Fixed Capital Formation) is £65bn lower. Household consumption also remains below £24bn its pre-recession peak. But it has been rising continuously for 2 year and now accounts for under half of the total decline in GDP. The fall in GFCF more than accounts for the entire fall in GDP.
It is not possible from the partial release of the data for the 2ndquarter of 2013 to establish the role of government in the continuing investment strike. But from the 1st quarter national accounts, it is clear that declining government investment has been exacerbating the private sector decline in investment. Government investment peaked under the last Labour government and has been cut continuously ever since.
But the analysis is confirmed by the separate ONS data on public finances. The presentation of the public finances data vary significantly from the presentation of government consumption data in the national accounts. Among the many differences is that the former are presented in nominal terms only. Even so, these show (Table PSF5) that in nominal terms the level of departmental outlays rose to £305bn in the first half of 2013, from £283bn in the same period of 2012. This is a rise of 7.8% and way above the rate of inflation.
Conclusion
There is no mystery to the current very weak recovery. It is led by a moderate increase in government spending, which more than accounts for the entire increase in GDP over the same period.
This runs counter to the government’s stated ‘austerity’ policy. But it is accompanied by a cut in government investment, which exacerbates the private sector investment strike. It is this investment strike which remains the source of the crisis, which cannot be resolved by increasing current spending.
Logic would dictate that any government which wanted to support the economy would increase investment, which is the source of the crisis. Conversely, any government fixated on deficit reduction would probably be inclined to cut both current and capital spending.
This government is committed to neither economic recovery nor deficit-reduction. Instead, it is committed to boosting profits. That is why it is willing to increase current spending which supports consumer demand but refuses to increase investment as this would displace private capital from potentially profitable sectors of the economy.
Since this government is not sticking to its own spending plans, it makes even less sense for an incoming Labour government to do so. Instead, it needs to address the source of the crisis by increasing state investment.


Sadly I think voters on the whole will be thankful for any recovery, sadly for labour it’s the Tories who are in power. As it has been in the past after a recession the people tend to give the party in power a bit longer to prove they can do it.
If Next year the recovery goes further life gets better the people will vote for what is not for what might be and they do not care how it done so long as it is happening.
MIliband spoke to day at the TUC conference about 1945 the great period of labour, so great that labour was out of power again in 1951 and stated out for a long time. If that was such a great period why did Labour try to change it with Blair.
The simple fact Blair has gone and we have Miliband he spoke OK today sadly he’s not the greatest speaker and like it or not the Tories have to say nothing really so long as the recovery is ongoing.
Nice of the Jaguar and land Rover to come out the day after Osborne’s speech.
Does this article really prove what it claims? To me it’s a classic case of having a view then finding some data that apparently backs up that view, rather than letting the data determine your opinion.
The core point of the article is that the recovery has been led by government spending since the annualised increase in GDP, £14.8bn is very similar to the increase in government expenditure of £15.1bn. (For the time being I will put aside the rather unusual way in which an annualised number has been created in the article and the way in which this could mislead). Apart from the fact that the two numbers are close to one another is there any proof that the increase in government spending has led to increased GPD? Why ignore the fact that exports are up from £119,895m to £121,057m? Using the method adopted in the article this would imply an annualised increase in exports of around £4.8bn, a useful addition to overall GDP.
The constituent that has added the most to GDP is the increase in household expenditure. This added £20bn to GDP using the author’s method of calculating annual GDP. The author attempts to dismiss this as being the cause of economic growth by saying that “rising government current spending tends to support consumption”. In other words without the government spending money then households wouldn’t have spent, so all the growth is due to government spending. I suspect that historically these two numbers will be positively correlated but as the author implies that is what you would expect in a growing economy. Correlation, not causation.
One way of testing the hypothesis that government spending increases are needed for economic growth is by looking for a period where the economy has grown without an increase in government spending. Well look at the period in the table for Q1 2010 to Q3 2011, a period of 6 quarters just as the author used to make his case. During this earlier period government spending was flat at £83.9bn. GDP however increased from £368bn to £376.8bn, an annualised increase of £35.2bn (8.8bn x 4). From this I believe you could conclude that increased government spending has no impact on economic output with as much conviction as the author makes his case. In fact maybe you could go further and say government expenditure damages growth since the annualised growth in the last 6 quarters in the table was only £14.8bn.
Finally back to the method used by the author. As you can see from the table there are quite a few numbers that go into the GDP numbers and some of these are very volatile. A few days’ bad weather will prevent households spending, possible decreasing GDP in one quarter. Exports move around a lot quarter by quarter as does capital formation. Finally there’s the statistical fix in the penultimate column. Given this randomness it’s very dangerous to conclude anything based on annualising quarterly numbers.